To get to zero by 2050, Indiana must cut climate pollution by 8.4 million metric tons of C02 equivalent a year.

Emissions in Indiana

Million metric tons of carbon dioxide equivalent (MMTCO2e) emissions

We can do it. Here's how.


CO2 Equivalent Emissions in Indiana by Source
🏭 Other: 38%🔌 Power: 37%🚗 Transport: 18%🏠 Buildings: 6%

    🏠 Buildings

    6% of emissions in Indiana comes from buildings.

    🏭 Other: 38%🔌 Power: 37%🚗 Transport: 18%🏠 Buildings: 6%

    Mostly from different types of heating.

    Gas furnace, gas water heater, gas stove

    80% of the pollution of your typical home comes from heating your space, water, and food.

    To stop this pollution, we need to replace our furnaces with electric heat pumps, electrify our water heaters, and cook with induction and electricity instead of gas.

    Electric heat pump, electric water heater, induction stove

    There are 3.4 million buildings in Indiana and 32% of building systems are already electrified.

    We need to electrify the remaining 2.3 million buildings in Indiana. That's around 83,000 per year.

    Percent of Building Systems electrifiedA chart showing the share of Building Systems that have already been electrified and still based in fossil fuel.31.53% have been electrified, and the remaining 68.47% are fossil fuel based.Building Systems ElectrifiedNot yet

    That will solve 6% of the problem.

    🏭 Other: 38%🔌 Power: 37%🚗 Transport: 18%🏠 Buildings: 6%

    🚗 Getting Around

    18% of emissions in Indiana comes from cars, trucks, and planes.

    🏭 Other: 38%🔌 Power: 37%🚗 Transport: 18%🏠 Buildings: 6%

    Mostly from our cars.

    To cut this pollution, if you have a car, your next one needs to be an electric vehicle (EV).

    Or try going car-free with public transit, bikes/e-bikes, or walking if it works for you.

    Gas emitting car being converted to electric car

    There are 2.1 million vehicles in Indiana and 7,000 are already electric (0.3% of the total).

    We need to electrify the remaining 2.1 million vehicles. That's around 76,000 a year.

    Percent of Vehicles electrifiedA chart showing the share of Vehicles that have already been electrified and still based in fossil fuel.0.3% have been electrified, and the remaining 99.7% are fossil fuel based.Vehicles ElectrifiedNot yet

    That will solve another 18% of the problem.

    🏭 Other: 38%🔌 Power: 37%🚗 Transport: 18%🏠 Buildings: 6%

    🔌 Power Generation

    37% of emissions in Indiana comes from making power.

    🏭 Other: 38%🔌 Power: 37%🚗 Transport: 18%🏠 Buildings: 6%

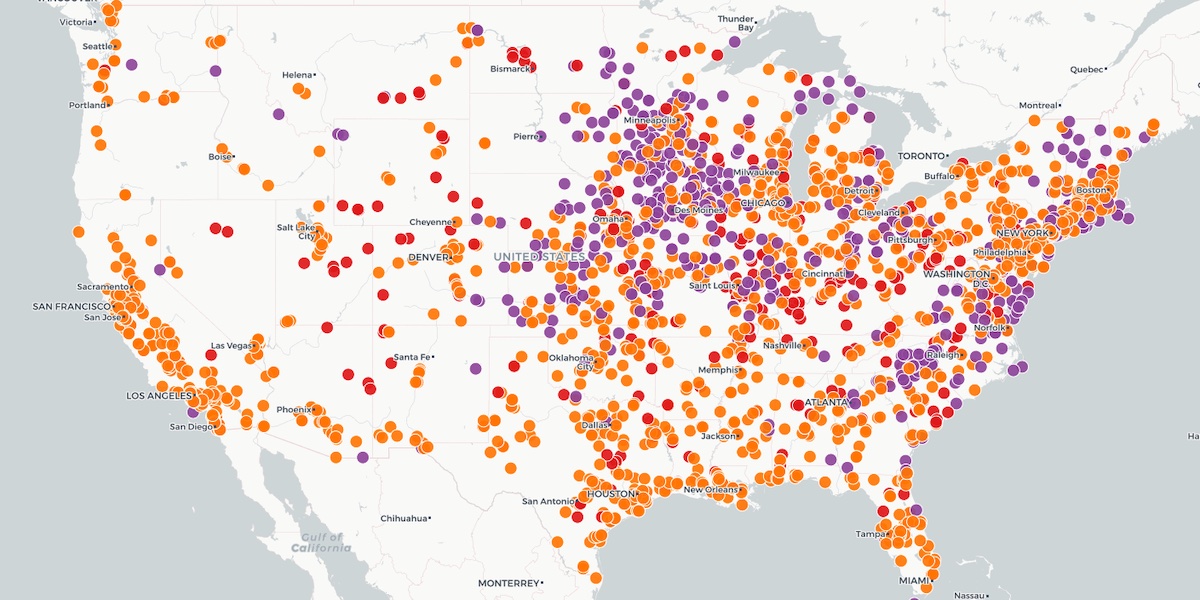
    Specifically from coal, gas, and oil plants.

    To cut this pollution, we need to replace all dirty power plants with clean ones (mostly wind and solar).

    We need to replace dirty power plants with clean ones (mostly wind and solar)

    In Indiana we need to close and replace:

    14 coal plants

    Name: Gibson
County: Gibson
Megawatt Capacity: 3,340
Utility: Duke Energy Indiana, LLC

    Gibson
    Gibson County
    3,340 MW

    Name: Rockport
County: Spencer
Megawatt Capacity: 2,600
Utility: Indiana Michigan Power Co

    Rockport
    Spencer County
    2,600 MW

    Name: R M Schahfer Generating Station
County: Jasper
Megawatt Capacity: 2,201
Utility: Northern Indiana Pub Serv Co

    R M Schahfer Generating Station
    Jasper County
    2,201 MW

    Name: IPL - Petersburg Generating Station
County: Pike
Megawatt Capacity: 2,155
Utility: Indianapolis Power & Light Co

    IPL - Petersburg Generating Station
    Pike County
    2,155 MW

    Name: Clifty Creek
County: Jefferson
Megawatt Capacity: 1,304
Utility: Indiana-Kentucky Electric Corp

    Clifty Creek
    Jefferson County
    1,304 MW

    Name: Cayuga
County: Vermillion
Megawatt Capacity: 1,185
Utility: Duke Energy Indiana, LLC

    Cayuga
    Vermillion County
    1,185 MW

    Name: Merom
County: Sullivan
Megawatt Capacity: 1,080
Utility: Hoosier Energy R E C, Inc

    Merom
    Sullivan County
    1,080 MW

    Name: Edwardsport Generating Station
County: Knox
Megawatt Capacity: 949
Utility: Duke Energy Indiana, LLC

    Edwardsport Generating Station
    Knox County
    949 MW

    Name: Alcoa Allowance Management Inc
County: Warrick
Megawatt Capacity: 823
Utility: AGC Division of APG Inc

    Alcoa Allowance Management Inc
    Warrick County
    823 MW

    Name: A B Brown Generating Station
County: Posey
Megawatt Capacity: 707
Utility: Southern Indiana Gas & Elec Co

    A B Brown Generating Station
    Posey County
    707 MW

    Name: Michigan City Generating Station
County: LaPorte
Megawatt Capacity: 680
Utility: Northern Indiana Pub Serv Co

    Michigan City Generating Station
    LaPorte County
    680 MW

    Name: R Gallagher
County: Floyd
Megawatt Capacity: 600
Utility: Duke Energy Indiana, LLC

    R Gallagher
    Floyd County
    600 MW

    Name: F B Culley Generating Station
County: Warrick
Megawatt Capacity: 415
Utility: Southern Indiana Gas & Elec Co

    F B Culley Generating Station
    Warrick County
    415 MW

    Name: Whitewater Valley
County: Wayne
Megawatt Capacity: 94
Utility: City of Richmond - (IN)

    Whitewater Valley
    Wayne County
    94 MW

    29 gas plants

    Name: St. Joseph Energy Center LLC
County: St Joseph
Megawatt Capacity: 2,186
Utility: St Joseph Energy Center LLC

    St. Joseph Energy Center LLC
    St Joseph County
    2,186 MW

    Name: Lawrenceburg Energy Facility
County: Dearborn
Megawatt Capacity: 1,232
Utility: Lawrenceburg Power, LLC

    Lawrenceburg Energy Facility
    Dearborn County
    1,232 MW

    Name: IPL - Harding Street Station (EW Stout)
County: Marion
Megawatt Capacity: 1,178
Utility: Indianapolis Power & Light Co

    IPL - Harding Street Station (EW Stout)
    Marion County
    1,178 MW

    Name: Sugar Creek Generating Station
County: Vigo
Megawatt Capacity: 1,128
Utility: Northern Indiana Pub Serv Co

    Sugar Creek Generating Station
    Vigo County
    1,128 MW

    Name: IPL - Eagle Valley Generating Station
County: Morgan
Megawatt Capacity: 1,040
Utility: Indianapolis Power & Light Co

    IPL - Eagle Valley Generating Station
    Morgan County
    1,040 MW

    Name: Vermillion Generating Station
County: Vermillion
Megawatt Capacity: 692
Utility: Duke Energy Ohio Inc

    Vermillion Generating Station
    Vermillion County
    692 MW

    Name: Whiting Clean Energy, Inc.
County: Lake
Megawatt Capacity: 577
Utility: BP Alternative Energy

    Whiting Clean Energy, Inc.
    Lake County
    577 MW

    Name: Wheatland Generating Facility LLC
County: Knox
Megawatt Capacity: 500
Utility: Duke Energy Indiana, LLC

    Wheatland Generating Facility LLC
    Knox County
    500 MW

    Name: Montpelier Electric Gen Station
County: Wells
Megawatt Capacity: 472
Utility: Kimura Power LLC

    Montpelier Electric Gen Station
    Wells County
    472 MW

    Name: Hoosier Energy Lawrence Co Station
County: Lawrence
Megawatt Capacity: 402
Utility: Hoosier Energy R E C, Inc

    Hoosier Energy Lawrence Co Station
    Lawrence County
    402 MW

    ...and 19 more

    2 oil plants

    Name: Hendricks Regional Health
County: Hendricks
Megawatt Capacity: 4
Utility: Hendricks Regional Health

    Hendricks Regional Health
    Hendricks County
    4 MW

    Name: Hurricane Creek Lift Station
County: Johnson
Megawatt Capacity: 2
Utility: Johnson County Rural E M C

    Hurricane Creek Lift Station
    Johnson County
    2 MW

    ...and help those workers find good jobs.

    But wait! Remember how we electrified all cars and buildings?

    Our machines don't pollute now, because they run on electricity!

    But that means we need to make more power for those new electric machines - twice as much power as we make now!

    And all of it needs to be clean power!

    So to cut the climate pollution from our power, cars, and buildings we need to INSTALL 9,000 MWs of wind and 10,000 MWs of solar.

    Since Indiana already has 101 megawatts of solar power generation and 902 megawatts of wind power generation, that's 301 Megawatts of wind capacity AND 351 Megawatts of solar capacity a year we need to build.

    Percent to Needed ElectrificationA chart showing the share of Solar and Wind capacity that has already been installed and rest to be installed. We are 6% of the way to what we need to be carbon neutral by 2050.Solar & Wind MWs InstalledRemaining to Install

    That will solve another 37% of the problem.

    🏭 Other: 38%🔌 Power: 37%🚗 Transport: 18%🏠 Buildings: 6%

    🏭 Other Emissions

    The last 38% of emissions in Indiana comes other sources

    🏭 Other: 38%🔌 Power: 37%🚗 Transport: 18%🏠 Buildings: 6%

    This includes industry, landfills, and farming.

    There's no one solution to solve these problems, but there are a lot of great ideas!

    These include:

    • Regenerative agriculture to sequester carbon in soil
    • Composting to reduce landfill methane emissions
    • New techniques for manufacturing CO2 emitting materials, like concrete


Ready to do your part?

Learn how to electrify your own machines and pass local policy to electrify the rest

Take Action